Map validation
Precision or accuracy?
Precision and accuracy are often used as synonyms. But they are not!
- Precision refers to the degree to which repeated attempts (under unchanged conditions) are close to each other, independent of their true value. Thus, a precise quantity might be completely wrong because biased!,
- Accuracy refers to the degree to which repeated attempts (under unchanged conditions) are close to the true value. Thus, an accurate attempt is precise and not biased.
Let’s see how precision and accuracy work. Assume that two archers are participating in a tournament.
The first archer always hit the same spot. He is precise.
However, his arrows are systematically displaced from the target’s centre (Fig. 1). Thus, the second archer is inaccurate.
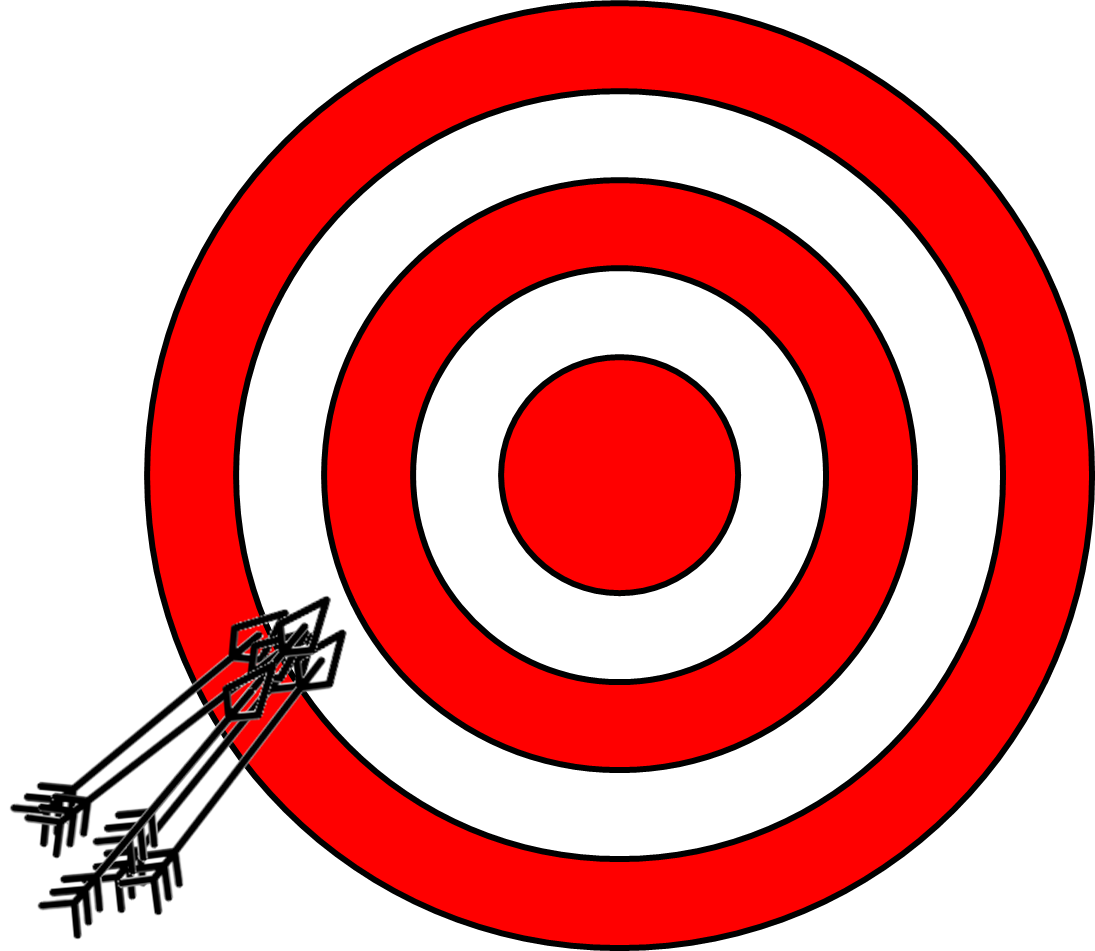
Fig. 1 The first archer’s shots.
The second archer fires all his arrows grouped in the target’s centre (Fig. 2).
The archer is precise and unbiased. Thus, the first archer is accurate.
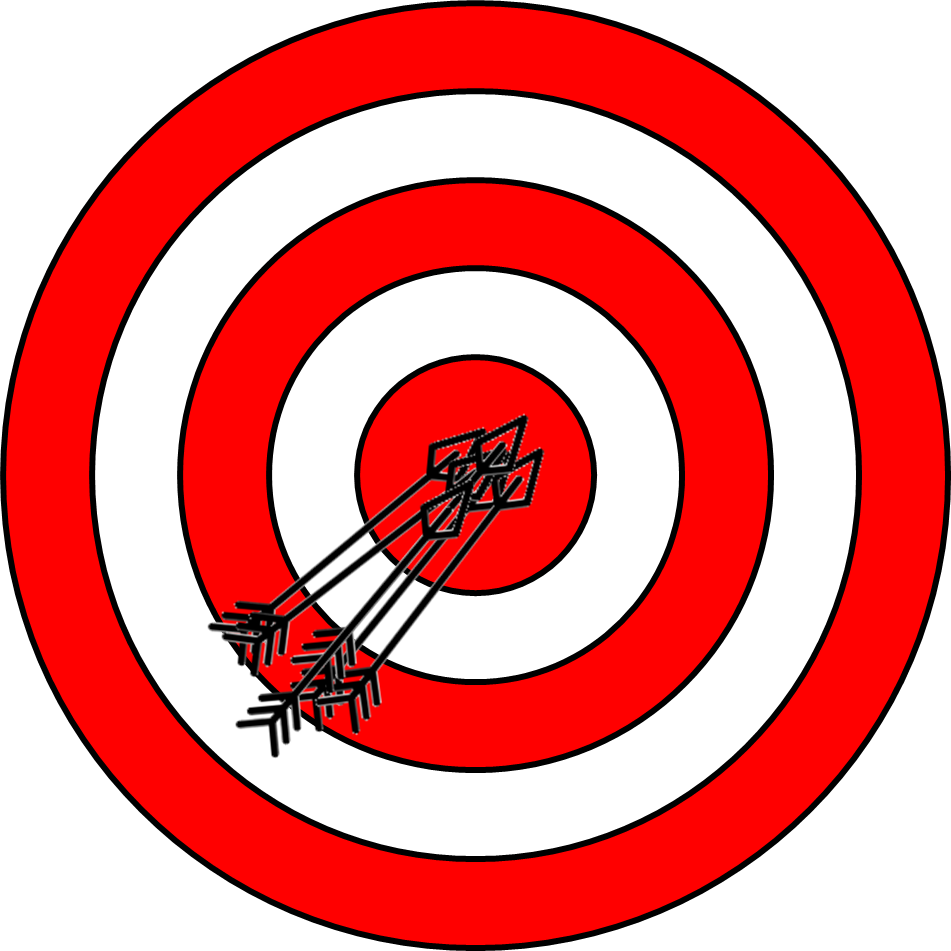
Fig. 2 The second archer’s shots.
Hint
For a land cover map:
- Accuracy refers to the degree to which the information on the map matches the real world,
- Precision refers to how exactly is the data used to create the map. This is also related to its spatial resolution, spectral characteristics, or time of acquisition (see Main characteristics of optical satellites).
How much is accurate a map?
Referring to the mapping process, accuracy is the most used performance metric and tells “how many sites are mapped correctly.”
Map accuracy is estimated using the confusion matrix, a table that relates the actual land cover of some KNOWN reference locations, called the testing samples, with their predicted values in the map.
Fig. 3 shows an example of a confusion matrix computed for a 4-class thematic map. In this table:
- Columns represent the instances of testing samples in the actual land cover class,
- Rows represent the instances of testing samples in the predicted land cover class,
- Instances belonging to the main diagonal (green cells) are the number of testing samples classified correctly.
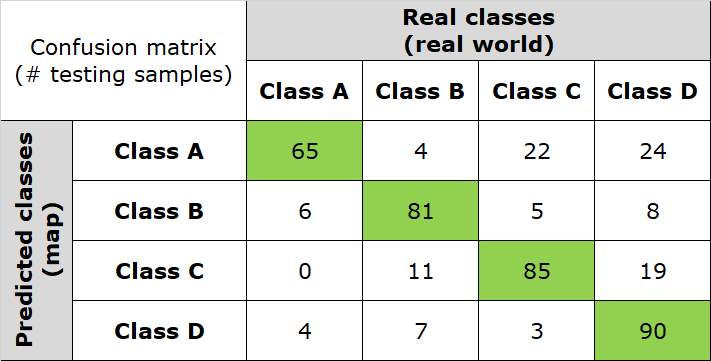
Fig. 3 Confusion matrix. Number of testing samples correctly classified.
Fig. 4 highlights the number of misclassified testing samples (red cells).
Overall, the confusion matrix has 434 testing samples.
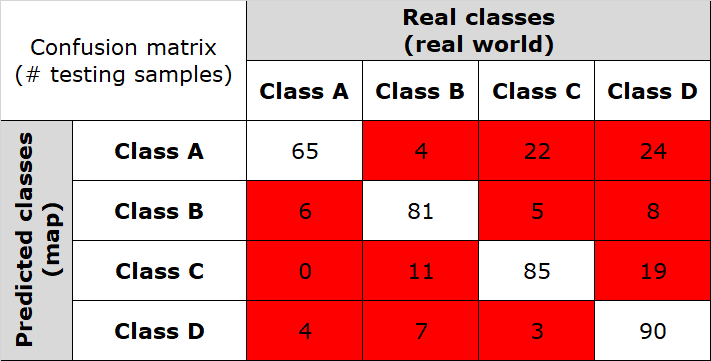
Fig. 4 Confusion matrix. Number of misclassified testing samples.
Note
What are the testing samples?
To evaluate the map’s accuracy, we must compare predicted land cover classes with actual land cover classes. This is done using the testing samples, which are image pixels randomly collected, but those actual land cover is KNOWN. Results are then extended from the testing samples to the full map.
GUIDELINE: testing samples must be randomly collected for ALL land cover classes. There should be no less than 50 testing samples for each land cover class.
a. Overall accuracy
Suppose we want to quantify the proportion of correct predictions, without giving any insight into the single accuracy of land cover classes. In other words, how many testing samples are globally labelled correctly in the classified map?
It is called overall accuracy and is usually expressed as a percent, with 0% being a perfect misclassification and 100% being a perfect classification:
In the example of Fig. 3 we have:
Note
The overall accuracy is the primary indicator used to evaluate maps.
b. Producer’s accuracy
Suppose we want to quantify the proportion of correct predictions for each of the real-world land cover class. In other words, for a given land cover class in the real world, how many testing samples are labelled correctly in the classified map?
This is the accuracy from the point of view of the mapmaker (the producer). It is called producer’s accuracy and is usually expressed as a percent, with 0% being a perfect misclassification and 100% being a perfect classification:
In the example of Fig. 3 we have:
Thus, the classifier is mapping real world class A with higher accuracy.
Note
The producer’s accuracy is an indicator of how well the actual land cover information is mapped.
c. User’s accuracy
Suppose we want to quantify the proportion of correct predictions for each of the mapped classes. In other words, for a given class in the map, how many testing samples are really present on the ground?
This is the accuracy from the point of view of the map user. It called is called user’s accuracy and is usually expressed as a percent, with 0% being a perfect misclassification and 100% being a perfect classification:
In the example of Fig. 3 we have:
Thus, the classifier is predicting the map’s class A with lower accuracy.
Typically, user’s and producer’s accuracy for a given land cover class are different. In the example of Fig. 3, 86.7% of the testing samples for real-world class A are correctly identified as class A in the map (producer’s accuracy). However, only 56.5% of the areas identified as class A in the map are actually being class A on the ground.
Note
The user’s accuracy is an indicator of how well the map describes the actual land covers.
Hint
Small activity
Which is the accuracy of your map?
Calculate the overall accuracy and the per-class producer’s accuracy and user’s accuracy of your own map. Try the free Confusion matrix online calculator.
See also
For additional information, see the practical guide on Map Accuracy Assessment and Area Estimation of FAO.